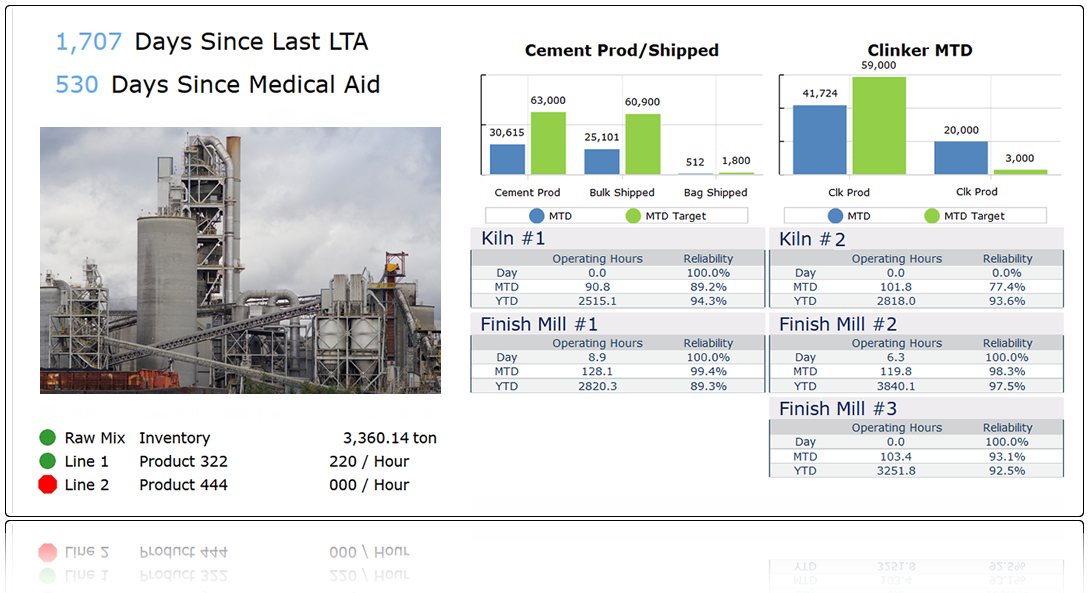
 Combine the display of current operating status with reliability data, month-to date KPI’s and graphics.
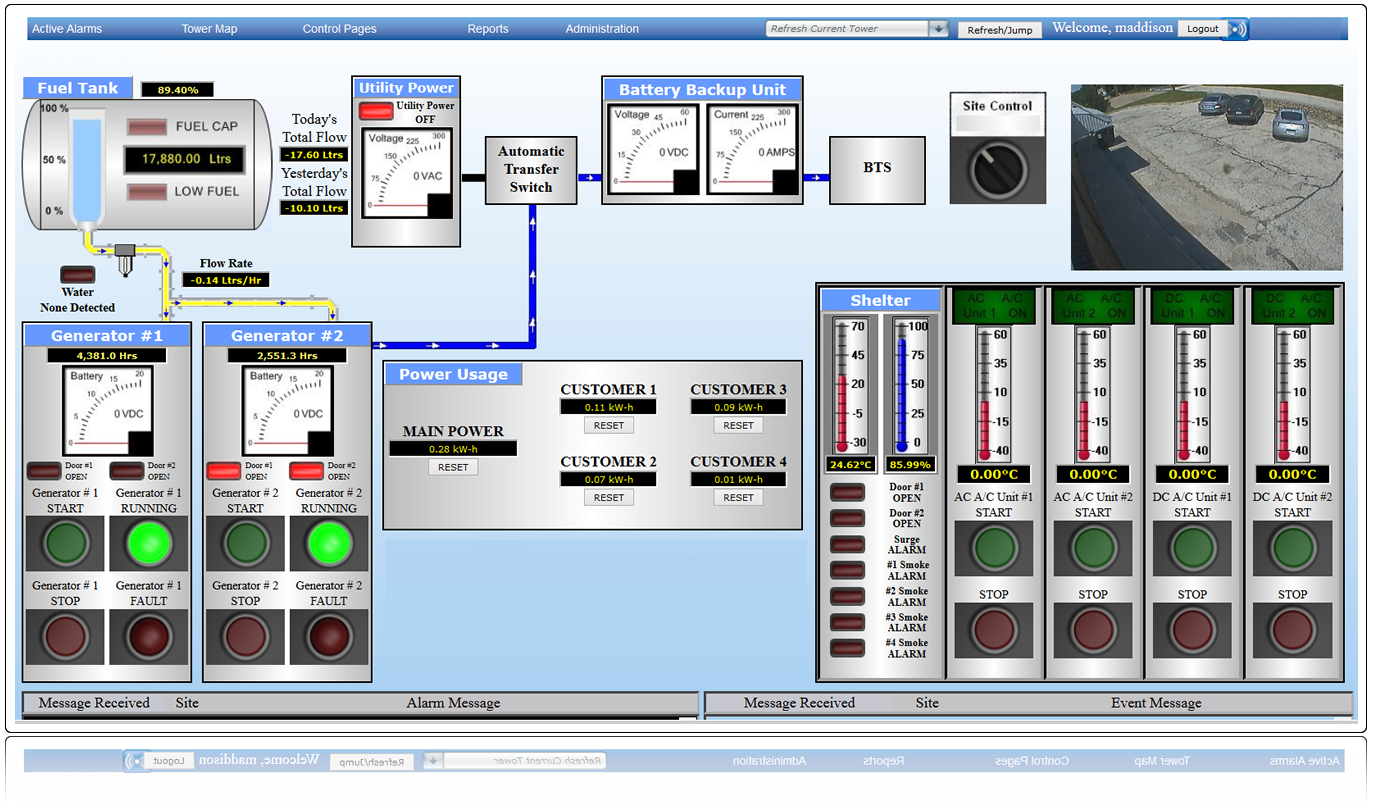 Create a visual representation of your process.
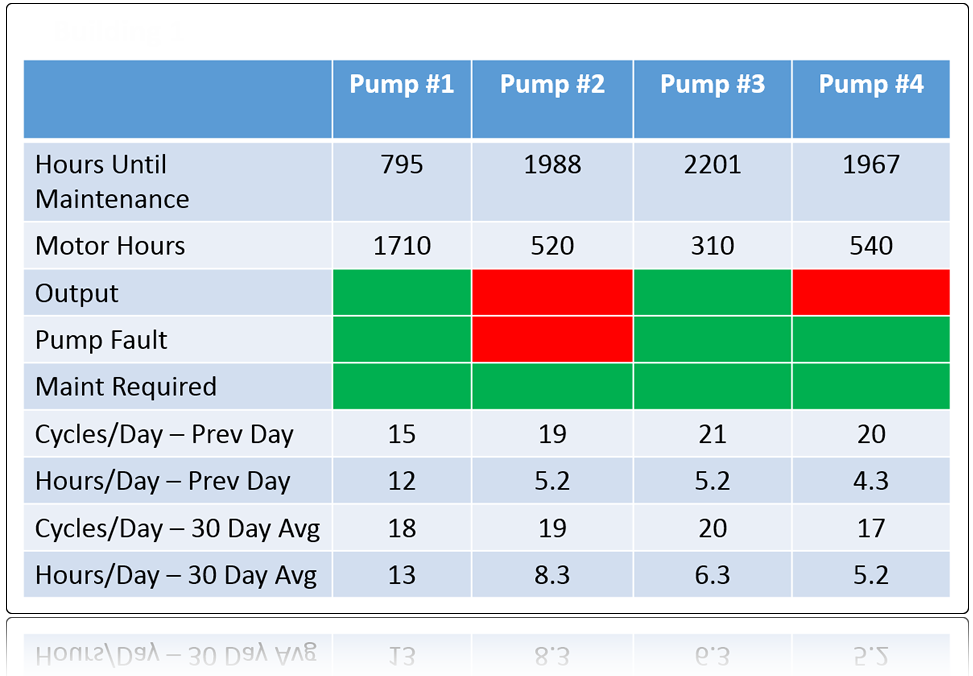 Display vital statistics on multiple pieces of equipment to provide critical information at a glance.
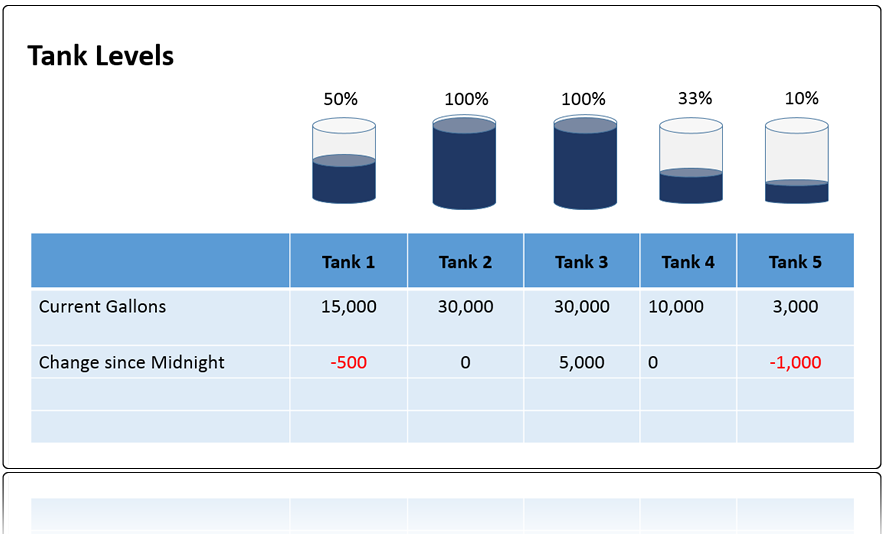 Whether monitoring remote equipment or multiple readings from one site, create graphical displays that make information management quick and easy.